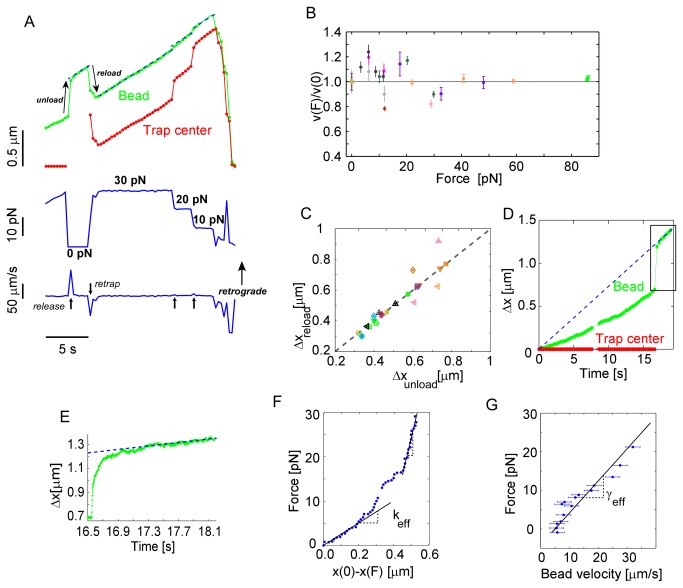
Figure 4. Elastic properties of nascent adhesions.
(A) Top panel: Bead (green) vs. trap (red) relative positions. Flow-coupled apCAM-coated bead (green) is successively clamped at different constant forces by changing the separation between the bead and the center of the optical trap (red). Middle panel: flow-coupled bead is first released from the optical trap (“unload” arrow) and then force-clamped (“reload” arrow) at 30, 20 and 10 pN successively. Bottom panel: bead velocity exhibits a transient for each change of force indicated by the black arrows (B) Steady bead velocity under constant force normalized to bead velocity under zero force. Same color symbols correspond to same bead clamped at different forces. For each particular experiment the laser power of the trap is first set and then the distance between trap and bead was adjusted. (C) Jump sizes of flow-coupled beads when released from (Δx unload) and reloaded by(Δx reload) optical traps. Same color symbols correspond to different events with the same bead and cell. (D-E) When a flow-coupled bead (green) was displaced by 0.7 µm from the trap center (red), the bead was released. Dashed lines in D and E depict the extrapolated position of actin features moving with retrograde flow. (F) In-plane force-displacement curve of nascent adhesion. Displacement is defined as the distance between the bead and the blue dashed line in D representing the trajectory of an unrestrained flow-coupled bead. (G) Force-velocity of the flow-coupled bead during relaxation calculated using bead trajectory in F and force-displacement curve in H.

