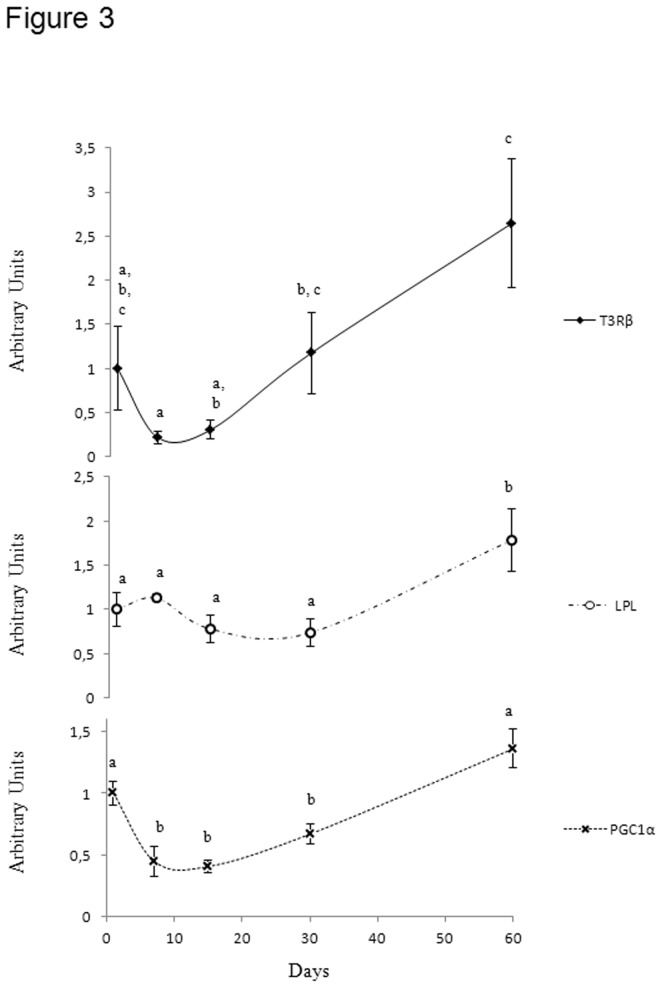
Figure 3. qPCR analysis of the expression of genes involved in transcriptional regulation and lipid metabolism.
Time course of the levels of triiodothyronine receptor (T3Rβ), lipoprotein lipase (LPL), peroxisome proliferator-activated receptor-γ co-activator-1α (PGC-1α) transcripts in the pectoralis muscle of 1, 7, 15, 30 and 60-day- old Adélie chicks. The relative expression of each gene was expressed as a ratio to β-actin mRNA level. N = 6 per group. Bars correspond to means ± S.E.M. Bars with different letters are significantly different at p<0.05.

