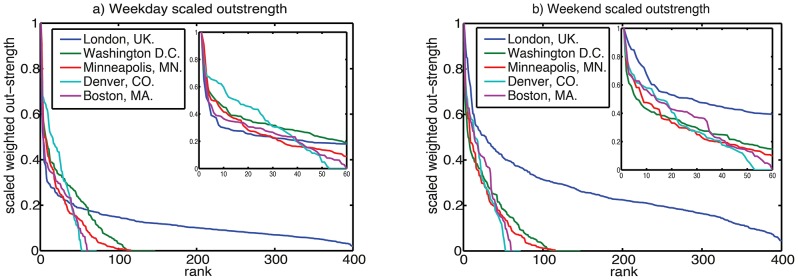
Figure 15. Rank/value plot of stand outdegree for each city.

Outdegree is scaled in each city so maximum outdegree is unity. a) All data b) Top 50 stands in each scheme.

Outdegree is scaled in each city so maximum outdegree is unity. a) All data b) Top 50 stands in each scheme.