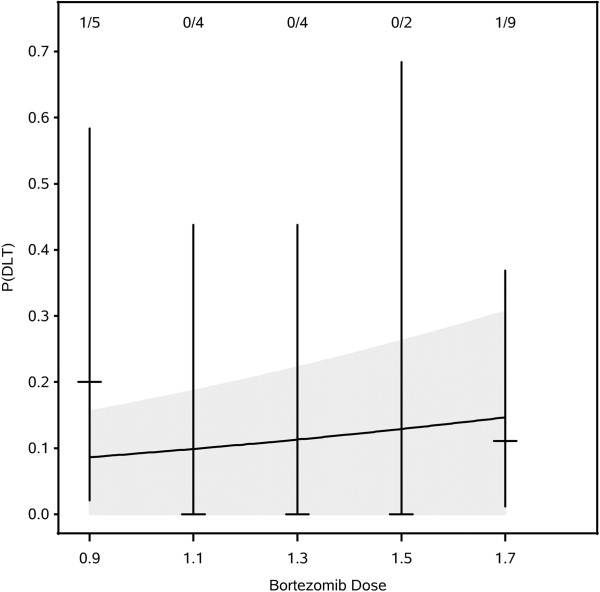
Figure 1.
Results of Markov Chain Monte Carlo estimation of dose-toxicity function. Posterior estimate of dose-toxicity function (black curve) with one-sided, 90% credible region (gray area). Vertical lines are 90% one-sided exact confidence intervals for per-dose probability of toxicity (tick marks). Numbers at the top are #DLTs/# evaluable patients.

