Figure 13.

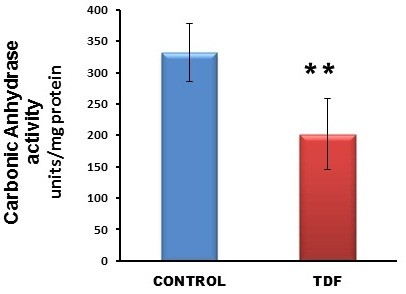
Carbonic anhydrase activity in the kidneys of control rats and TDF treated rats. Data represent mean ± SD, n = 6 in each group, ** p < 0.01 compared with controls.

Carbonic anhydrase activity in the kidneys of control rats and TDF treated rats. Data represent mean ± SD, n = 6 in each group, ** p < 0.01 compared with controls.