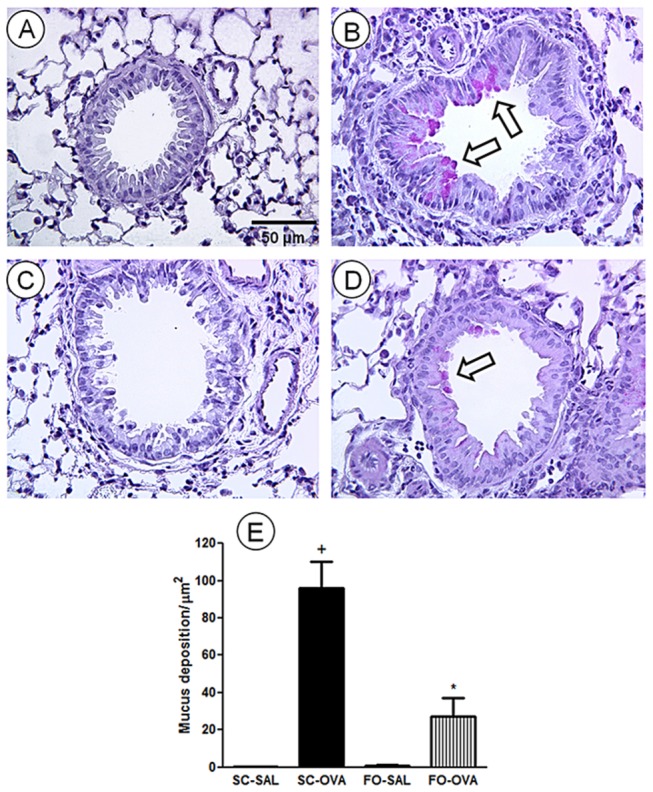
Figure 4. Effect of FO intake on allergen-evoked mucus production in A/J mouse lungs.

Photomicrographs were taken of representative airways from (A) sensitized, saline-challenged (SC-SAL); (B) sensitized, ovalbumin-challenged (SC-OVA); (C) sensitized, saline-challenged with fish oil (FO-SAL) and (D) sensitized, ovalbumin-challenged with fish oil (FO-OVA). (E) Quantitative assessment of mucus production was performed by morphometric analyses. The analyses were performed 24 hours after the last challenge. Slides were stained with periodic acid-Schiff. Arrows indicate representative mucus deposition. In the signaled cases, P<0.05 compared with the SC-SAL group (+) and the SC-OVA group (*) (one-way ANOVA and post-hoc Holm-Sidak test). Values are the means ± S.E.M and are representative of 1 experiment (n=5 per group).
