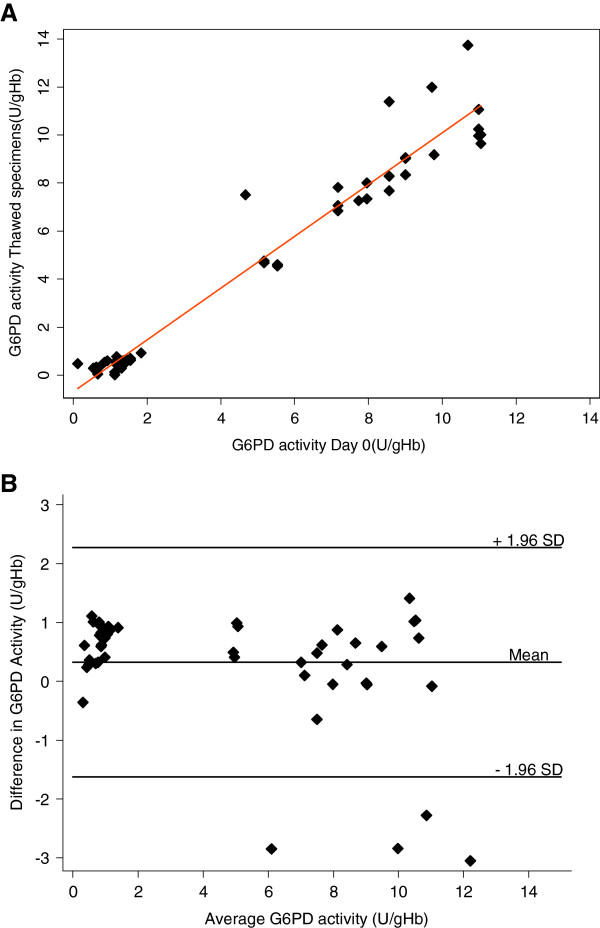
Figure 1.
Correlation in G6PD activity values between fresh specimens (Day 0) and cryopreserved specimens. (A) Direct comparison of G6PD activities for fresh and cryopreserved specimens is shown. The solid line indicates the linear regression fit. (B) Bland-Altman plot for differences in G6PD activity between fresh and cryopreserved specimens.

