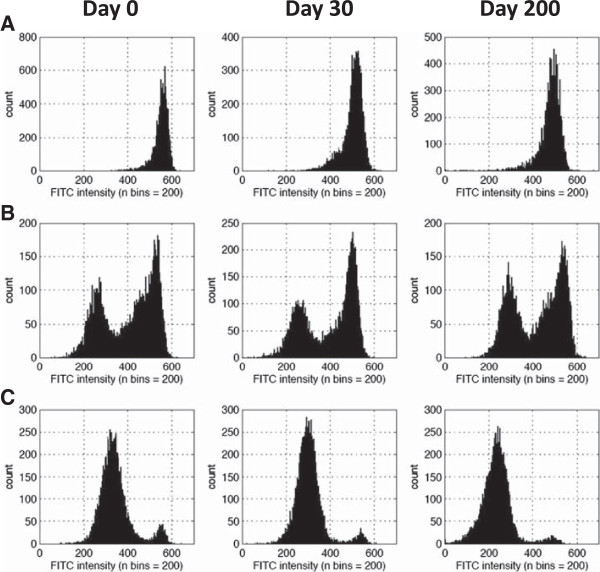
Figure 3.
Distribution of G6PD activity within red blood cell popoulations of fresh and cryopreserved specimens. Intracellular G6PD activity distributions as indicated by flourscence are shown for (A) a normal male, (B) heterozygous female, and (C) deficient male specimens. Intracellular G6PD activity profiles are shown for Day 0 prior to cryopreservation and two separate dates at which the same specimen was thawed after cryopreservation.

