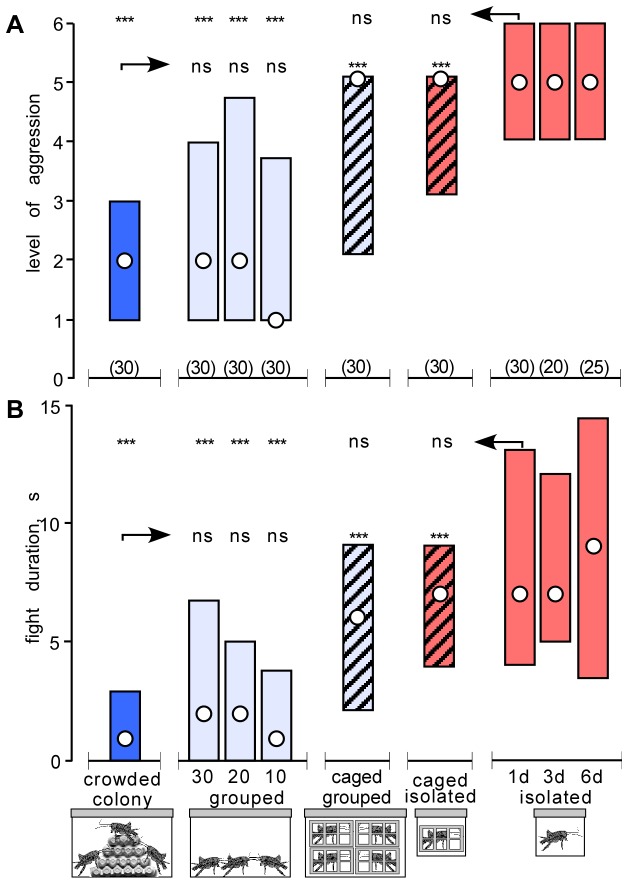
Figure 1. Effects of crowding and isolation on cricket aggression.
(A, B) Bar graphs giving the level and duration respectively (circles: medians, bars: interquartile range) of aggression for encounters between pairs of male, weight matched crickets taken from the same test groups (from left to right): crowded colony (dark blue), grouped (light blue: groups of 30, 20, and 10 individuals as indicated), caged-grouped (light blue, hatched), caged-isolated (red, hatched), isolated (red: for 1, 3 and 6 days as indicated). Numbers in parentheses above the x-axis in A give the number of pairs or crickets for each group. Significant differences between groups are indicated (Mann–Whitney U-test, * p < 0.05, ** p < 0.01, *** p < 0.001, ns not significant).

