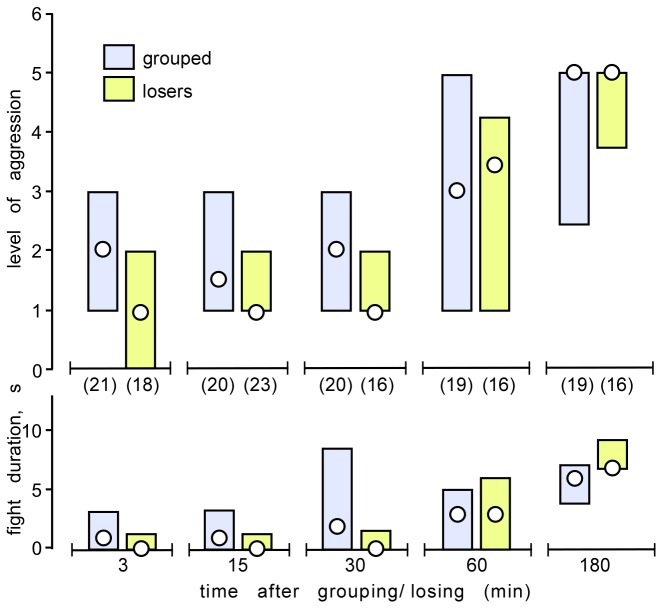
Figure 4. Recovery from crowding and losing.
(A, B) Bar graphs comparing the level and duration respectively (circles: medians, bars: interquartile range) of aggression for encounters between pairs of male, weight matched crickets that were previously grouped (blue bars) or had lost a previous fight (losers; yellow bars). Each individual bar gives data from a different set of crickets each observed at different times after either isolation or losing; the number of pairs tested for each is given in parentheses under the x-axis in A. The differences between grouped and loser crickets for each time period are not statistically significant (Mann–Whitney U-test).

