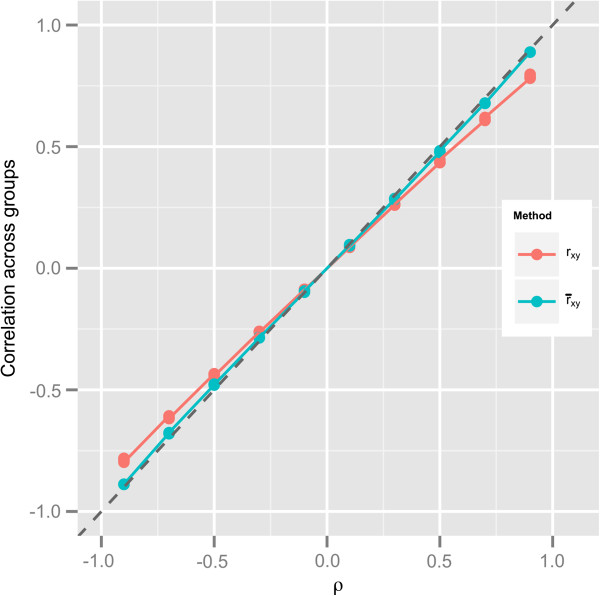
Figure 3.
Correlation coefficients obtained from a pool of N heteroskedastic groups. rxy was obtained from pooling N groups of simulated data (shown in red), and was obtained from averaging within groups correlation (shown in blue); ρ is the true correlation within each group. This plot shows that the error between and ρ is smaller than the error between rxy and ρ. Simulation parameters: μxy,i = (2,2),  , −0.9 ≤ ρ ≤ 0.9, ni = 10, λi = λ, and 0.01 ≤ λ ≤ 0.1 for i = 1,N and 10 ≤ N ≤ 100.

