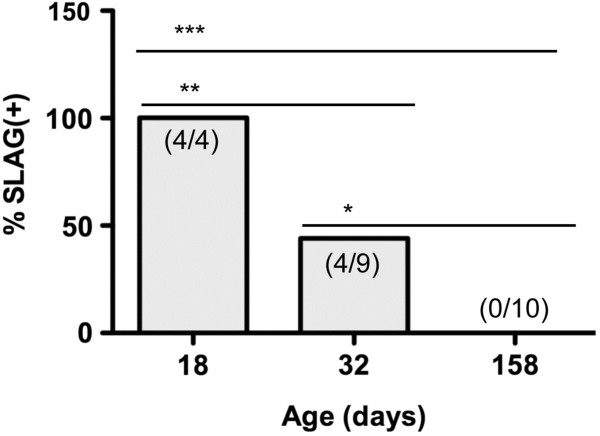
Figure 4.
FVB mice are SLAG(+) when young, but become SLAG(−) upon aging. Female FVB mice of three different ages (x-axis) were subjected to SLAG testing. Each bar graph shows the number of SLAG(+) / total number of mice: 4/4, age 18 days; 4/9, age 32 days; 0/10 age 158 days. The bar graphs display the percentage of SLAG(+) mice for each age group. One-tailed Chi-square analysis showed statistical differences between age groups: *** p < 0.0001, ** p = 0.008, * p = 0.03.

