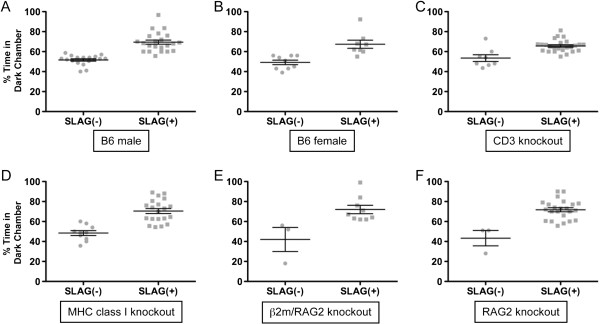
Figure 7.

SLAG performance correlates with Dark Chamber (DC) preference across various experimental groups. All experimental groups compared here displayed a statistically significant increase in DC preference for SLAG(+) compared with SLAG(−) mice (means +/− SE bars displayed). (A) For B6 males, mean time spent in DC: SLAG(−) = 52%, SLAG(+) = 69% (unpaired two-tailed t-test, means are significantly different, p < 0.0001; two-tailed Mann–Whitney test, p < 0.0001). (B) For B6 females, mean time spent in DC: SLAG(−) = 49%, SLAG(+) = 67% (unpaired two-tailed t-test, means are significantly different, p = 0.0011; two-tailed Mann–Whitney test, p = 0.0017). (C) CD3 knockout mice include CD3 δ−/− and CD3ϵ−/−ζ−/− pooled together. Mean time spent in DC: SLAG(−) = 54%, SLAG(+) = 66% (unpaired two-tailed t-test, means are significantly different, p = 0.0002; two-tailed Mann–Whitney test, p = 0.0019). (D) MHC class I knockout mice include β2m−/− and H-2KbDb−/− pooled together. Mean time spent in DC: SLAG(−) = 48%, SLAG(+) = 70% (unpaired two-tailed t-test, means are significantly different, p < 0.0001; two-tailed Mann–Whitney test, p < 0.0001). (E) For β2m/RAG2 double knockout mice, mean time spent in DC: SLAG(−) = 42%, SLAG(+) = 72% (unpaired two-tailed t-test, means are significantly different, p = 0.0116; two-tailed Mann–Whitney test, p = 0.016). (F) For RAG2 knockout mice, mean time spent in DC: SLAG(−) = 43%, SLAG(+) = 72% (unpaired two-tailed t-test, means are significantly different, p = 0.0001; two-tailed Mann–Whitney test, p = 0.0063).
