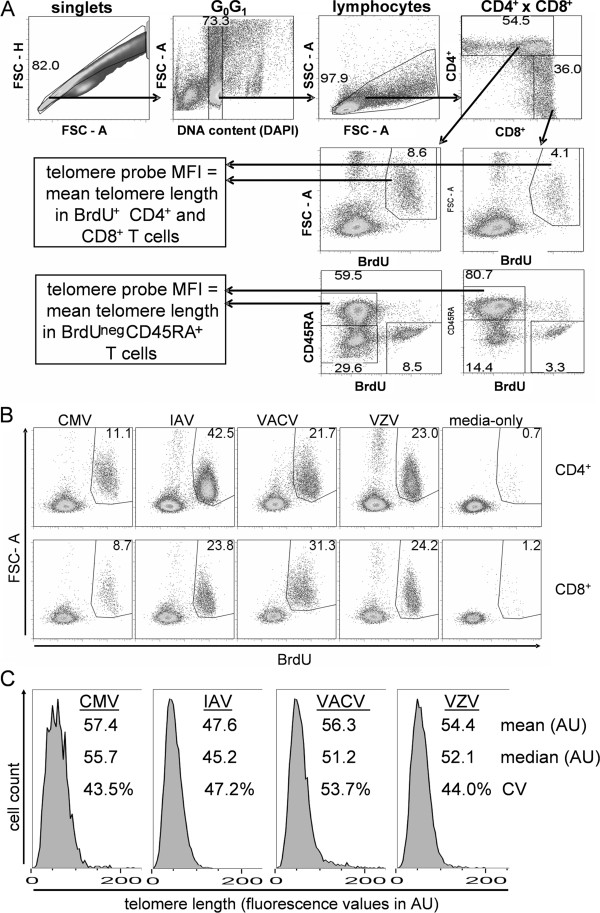
Figure 2.
BrdU-flowFISH allows for TL measurement in proliferating CD4+ and CD8+ T lymphocytes. (A) Flow cytometry gating strategy for TL measurement from probe mean fluorescence intensity (MFI) in BrdU+ CD4+ and CD8+ cells and in BrdU-negative naïve (CD45RA+) T cells. (B) Representative proliferative responses (BrdU+ FSC-Ahigh population) of CD4+ and CD8+ T cells to viral antigen. Values shown are frequencies of CD4+ or CD8+ T cells that were BrdU+. (C) Histograms of TL distribution for virus-specific CD4+ T cells defined as in B. Mean and median fluorescence intensity values, in arbitrary units (AU), are shown for each plot. Coefficient of variation (CV) is also shown.

