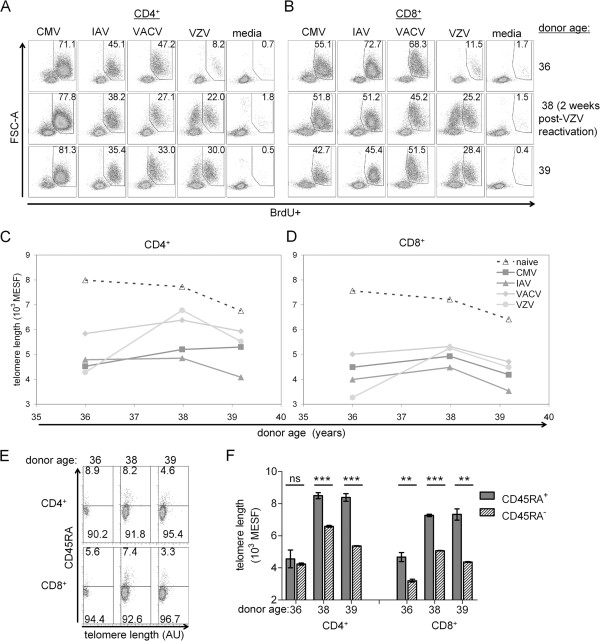
Figure 7.
Reactivation associated with increased proliferative responses and restored TL in VZV-specific CD4+ and CD8+ T cells. Dot plots show virus-specific (A) CD4+ and (B) CD8+ proliferative responses across three time points in the same subject. BrdU+ frequencies (percent) are shown in the gate. PBMC were collected approximately two years prior (top row), two weeks after (middle row) or fourteen months after (bottom row) VZV reactivation. Graphs depict mean TL in (C) CD4+ and (D) CD8+ T cells along with TL in naïve T cells (from media-only culture BrdU-CD45RA+) (dashed line) across the three time points. (E) VZV-specific CD4+ and CD8+ T cell from A and B are further delineated by CD45RA expression. (F) Mean TL for VZV-specific T cells by CD45RA expression shown in 4E. Error bars are standard errors from triplicate hybridizations of the same sample. By unpaired t-test, *** p < 0.001, ** p < 0.01, ns = not different.

