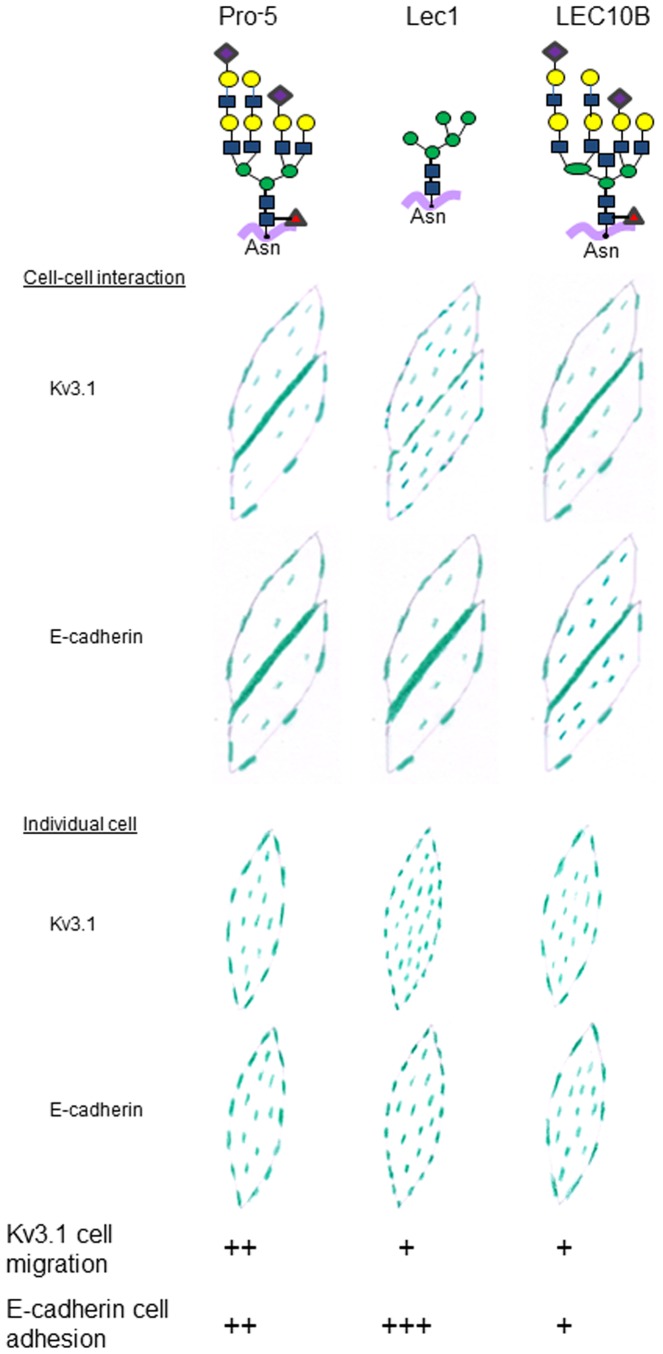
Figure 7. Model depicting the information encoded by glycan structures of Kv3.1 and E-cadherin.
Top drawings show predominant glycans present in each CHO cell line studied [14]. In the cell drawings, green dashes denote the relative amounts of GFP tagged Kv3.1 or E-cadherin particles in the adhered membrane of interacting (Figure 3) and non-interacting (Figure 4) cells. The relative effects of the glycoproteins on cell migration (Figure 5) and cell adhesion (Figure 6) are shown with (x) signs.

