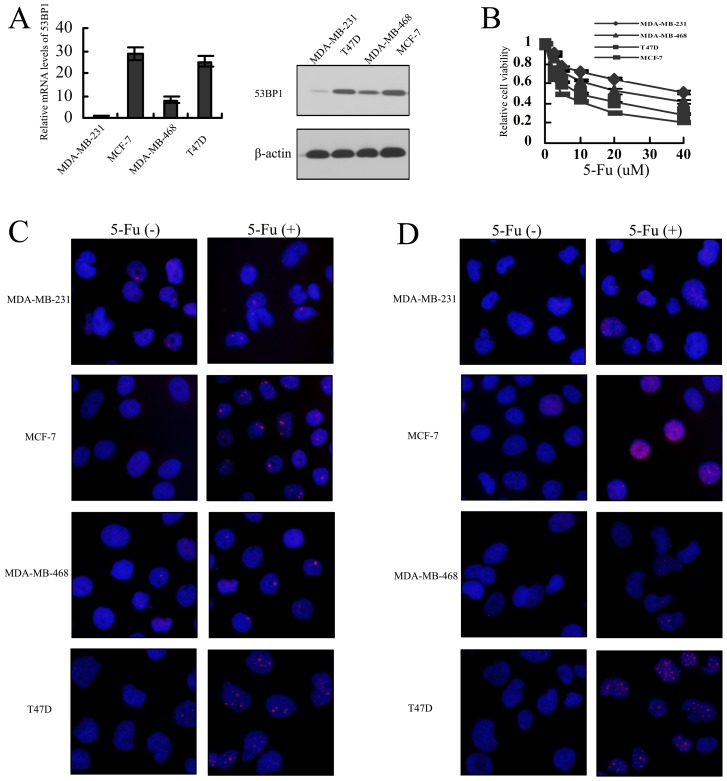
Figure 1. Expression of 53BP1 correlates with 5-Fu sensitivity in breast cancer cell lines.
(A) Expression mRNA levels and protein levels of 53BP1 in breast cancer cell lines. GAPDH or actin was used as the endogenous control. (B) The sensitivity of breast cell lines to 5-Fu were tested with MTT assay. The data were expressed as mean ± SD. (C) The localization of 53BP1 in breast cancer before and after the treatment of 5-Fu (5 uM). The immunofluorescent images of cells were stained with 53BP1 antibody. The nuclear staining with Nuclei was counterstained with DAPI. Red, 53BP1; Blue, DAPI. (D) The localization of H2AX in breast cancer before and after the treatment of 5-Fu. The immunofluorescent images of cells were stained with H2AX antibody. The nuclear staining with Nuclei was counterstained with DAPI. Red, H2AX; Blue, DAPI.

