
Figure 7. Trial sequential analysis of 44 trials assessing vitamin E in a dose above the RDA (> 15 mg) daily versus placebo.
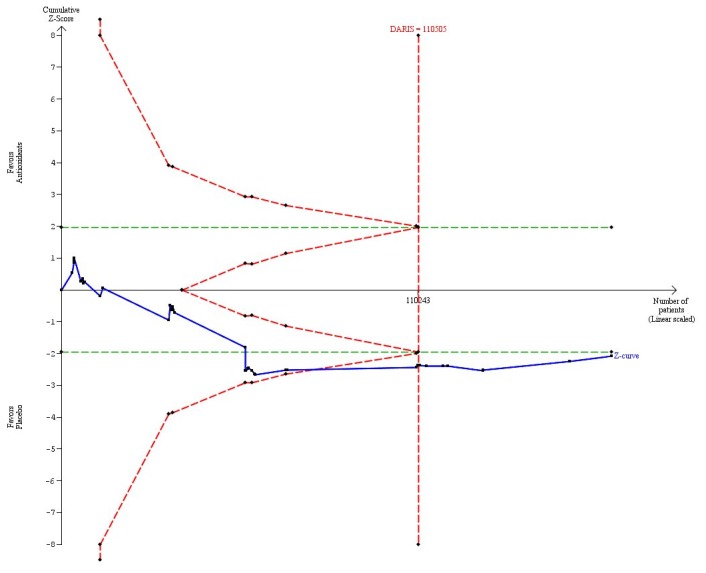
The diversity-adjusted required information size (DARIS = 110,505 participants) was based on a proportion of deaths of 10% in the placebo group; a relative risk reduction of 5% in the vitamin E group; an alpha of 5%; a beta of 20%; and a diversity of 0%. The blue line represents the cumulative Z-score of the meta-analysis. The green lines represent the conventional statistical boundaries. The red inward sloping lines represent the trial sequential monitoring boundaries. The red outward sloping lines represent the area of futility.