
Figure 3.
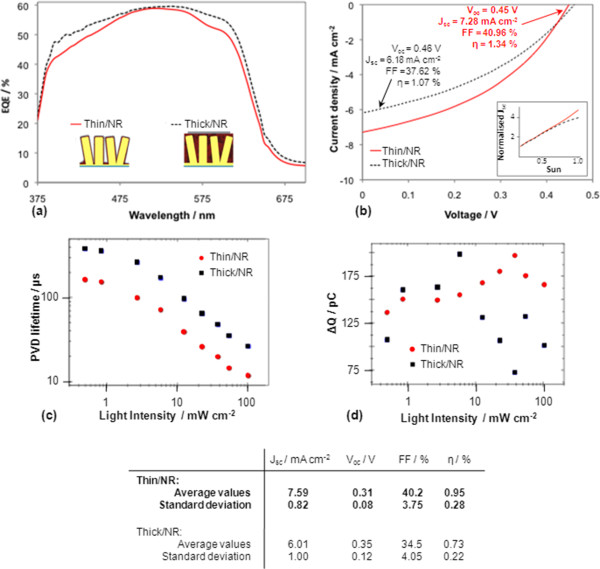
EQE, J-V curves, PVD data and transient charge of best cells plus average photovoltaic parameters. (a) EQE of best performing Thin/NR and Thick/NR cells (idealised cell designs in the inset). (b)J-V curves of best performing cells of both architectures produced in this study. Inset in (b) shows Jsc as a function of light intensity for both types of cells. (c) Photovoltage decay lifetime of charges in both architectures as a function of light intensity. (d) Transient charge as a function of incident light intensity for both architectures. The table shows average photovoltaic parameters obtained from several devices for each of the two cell designs produced in this work.