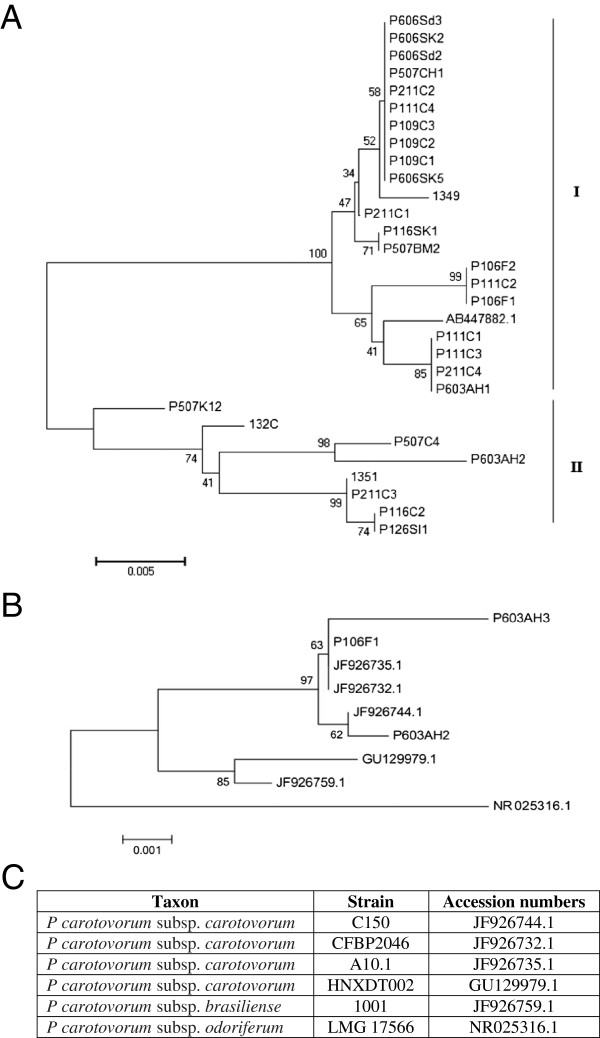
Figure 2.
Phylogenetic tree based on a comparison of pmrA sequences (A) and 16S rRNA (B) for Pectobacterium carotovorum subsp. carotovorum. (C) Accession numbers of 16S rRNA sequences used for sequence alignments and construction of phylogenetic tree. The branching pattern was generated by the Neighbor-Joining method [31]. The numbers at the nodes indicate the levels of bootstrap support based on a Neighbor-Joining analysis of 500 resampled data sets. The evolutionary distances were computed using the Maximum Composite Likelihood method [32] and are in the units of the number of base substitutions per site. The generation of tree was conducted in MEGA5 [33].

