
Figure 2.
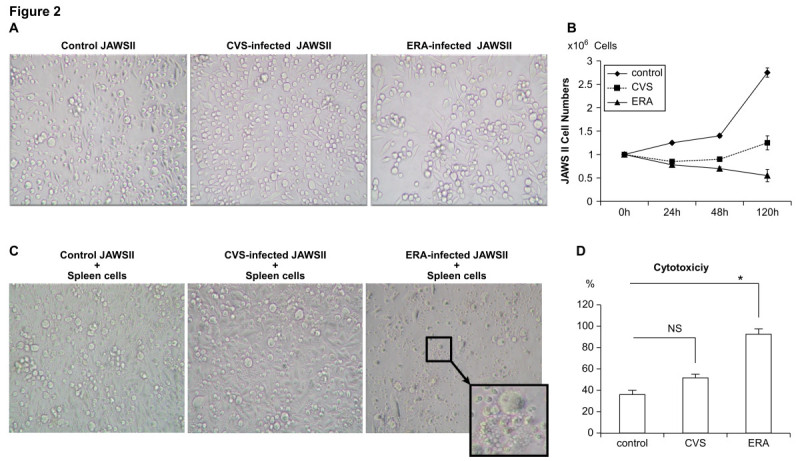
Morphological changes in JAWS II cells after RABV infection and coculture with mouse spleen cells. (A) Light-microscopic images of uninfected (left), CVS-infected (middle), and ERA-infected (right) JAWS II cells; (B) the numbers of viable cells were determined by Trypan blue staining 24, 48, 120 h after re-plated. (C and D) uninfected (left), CVS-infected (middle), and ERA-infected (right) JAWS II cells were cocultured with mouse spleen cells for a further 120 h and the cytotoxicity was calculated with a cell death kit. All the experiments were performed three times at an MOI of 10 and representative data are shown (A and C). Error bars represent mean ± SEM (B). *p < 0.01 (D).