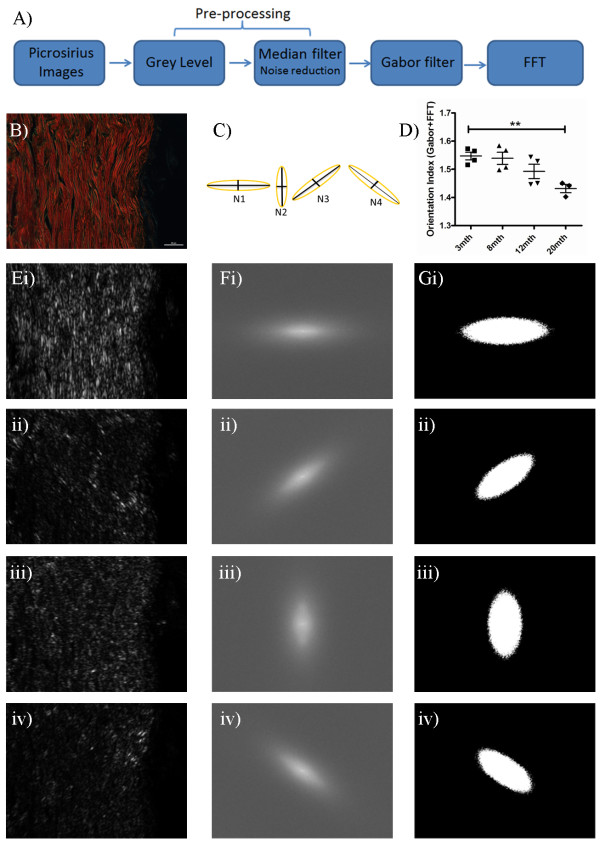
Figure 3.
Quantification of dermal integrity from spectra derived from Gabor filtering and FFT. A) Flowchart depicting the different stages of analysis. B) Typical 3mth C57Bl6 mouse skin stained with picrosirius and viewed under cross-polar optics (original magnification 90X, scale bar = 20 μm). C) Illustration of the ellipse measurements generated to produce the collagen orientation index (N) from the elliptical axes generated from ω values N1-N4. D) Alterations in dermal integrity with age. To illustrate the procedure for quantifying spectra, the original image after pre-processing and Gabor filtering is shown in E (i-iv in each ω direction), and the FFT spectra in F (i-iv in each ω direction) conversion of the resultant spectra to binary ellipses for quantification in G (i-iv in each ω direction).

