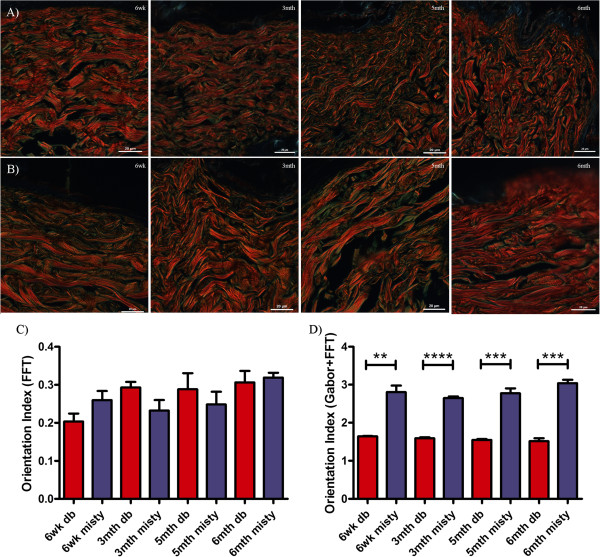
Figure 5.
Dermal collagen organisation in the diabetic mouse. Representative images of A) Misty and B)db/db diabetic skin from mice at 6wk, 3mth, 5mth and 6mth stained with picrosirius. Quantification using the Gabor/ FFT methodology (C) or by FFT alone (D), the bar equates to the mean and hair lines are standard error of the mean (S.E.M.). Students’ t-test was used to compare diabetic and lean mice at each time-point, and time course comparisons within db/db and Misty groups were compared with a one way ANOVA and a Dunnett’s post-hoc analysis using 6wk old animals as the reference group: ** p < 0.01; *** p < 0.001 (n > 3 animals per group, original magnification 90X, scale bar = 20 μm in each case).

