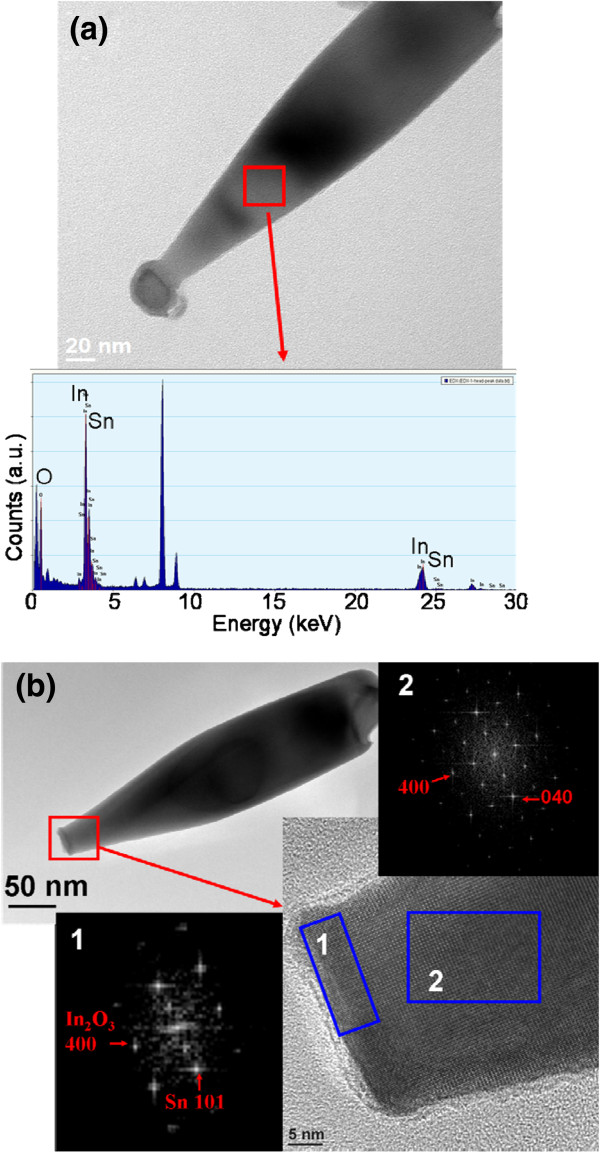
Figure 8.

TEM and HRTEM images of the bowling pin-like nanostructures. (a) Low-magnification TEM image and EDS spectrum of the single In-Sn-O nanostructure. (b) HRTEM images and corresponding FFT patterns taken from the various regions of the nanostructures. The intense peak at approximately 8 keV originated from the copper grid.
