Figure 2.

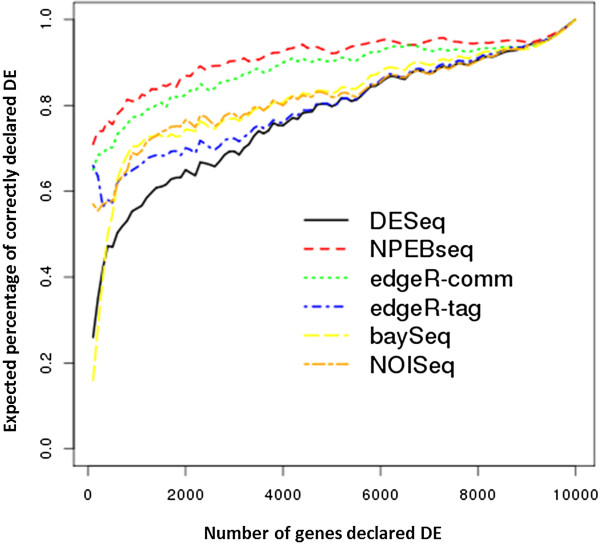
Simulation results of comparing the performance of DESeq, edgeR and NPEBseq on dataset1. The x axis denotes τ and y axis denotes pτ.

Simulation results of comparing the performance of DESeq, edgeR and NPEBseq on dataset1. The x axis denotes τ and y axis denotes pτ.