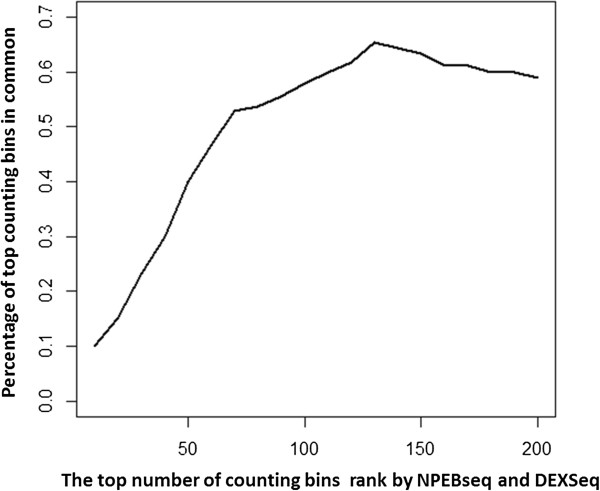
Figure 6.

Percentage of DE exons that are common in the two ranked lists of exons generated by NPEBseq and DEXSeq programs. While x-axis denotes the number of declared DE exons and the y-axis denotes the percentage of common calls between both the programs.
