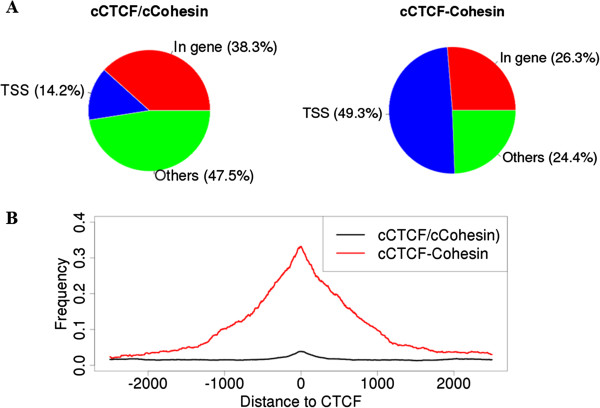
Figure 4.

Genomic distributions of the 12,014 cCTCF/cCohesin and the 925 cCTCF-cCohesin sites. (A) Pie charts. If a binding site is within ±5 kb from the transcription start site (TSS) of a reference gene (GRCh37), it was annotated as ‘TSS’. Otherwise, if it is located between the TSS and the transcription end site of a gene, it was annotated as ‘in gene’. All others were annotated as “others”. (B) The density of CpG islands. For each CTCF binding site, we computed the cumulative density of the CpG islands within ±2.5 kb centered at the site.
