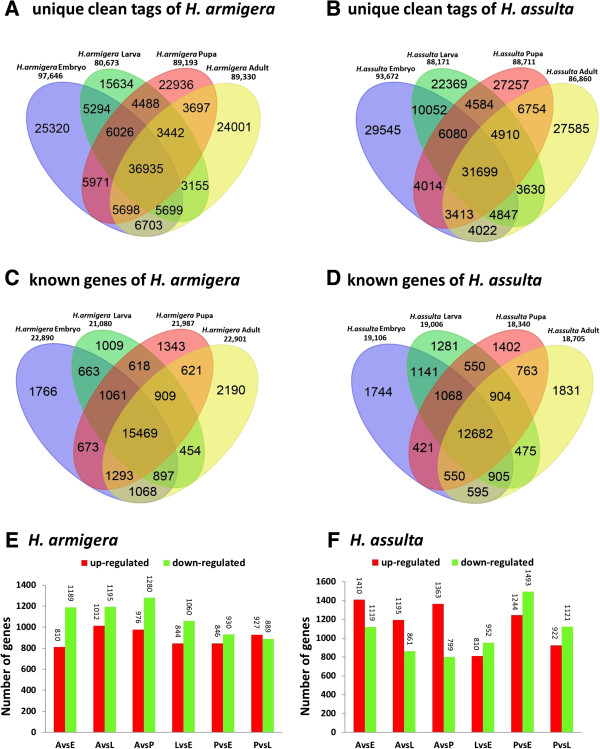
Figure 3.
Gene expression analysis of the H. armigera and H. assulta. (A) and (B): Venn diagram of unique clean tags showing the differential expression or coexpression between pairs developmental stages of H. armigera and H. assulta. (C) and (D): Venn diagram of known genes showing the differential expression or coexpression between two to four developmental stages of H. armigera and H. assulta. (E): Up- or downregulated expression of genes in H. armigera. (F): Up- or downregulated expression genes in H. assulta. E: Embryo stage; L: Larval stage; P: Pupal stage; A: Adult stage.

