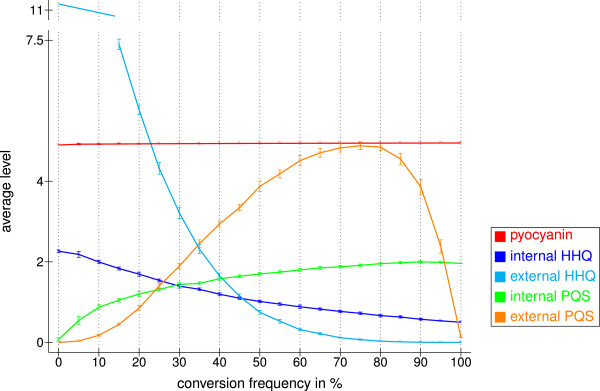
Figure 5.

Effect of the PQS production rate. Effect on the average levels of the autoinducers HHQ and PQS, as well as that of pyocyanin. The reported values are mean levels in the time interval 100 to 600 averaged over ten runs obtained with different random numbers and their standard deviations. The conversion frequency represents the probability that PQS is produced by PqsH. The degradation frequency was set to once per 20 time steps and the transport threshold to three.
