Figure 7.

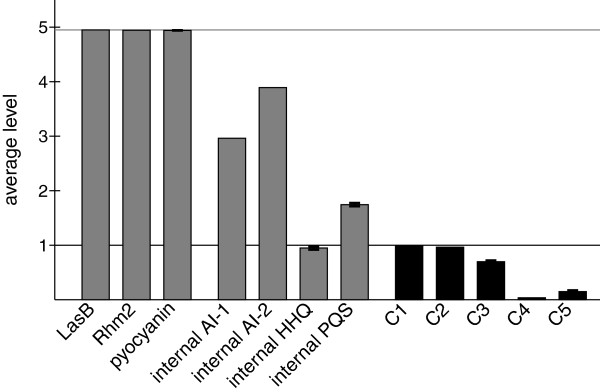
Behavior of wild type. Lines denote the maximum value for bars with the same color. Shown are average levels in the time interval 100 to 600 averaged over ten runs obtained with different random numbers and their standard deviations.

Behavior of wild type. Lines denote the maximum value for bars with the same color. Shown are average levels in the time interval 100 to 600 averaged over ten runs obtained with different random numbers and their standard deviations.