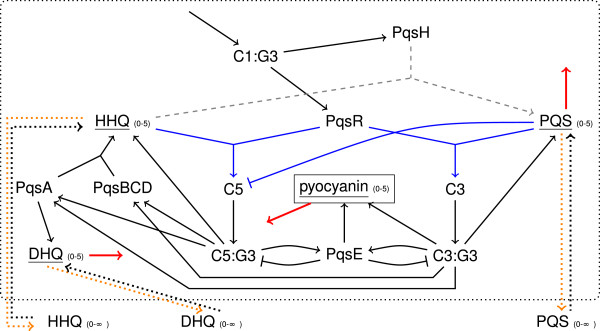
Figure 8.

Detailed view of the pqs system. Black edge = threshold is 1; blue edge = state of underlined node must be at least 2; orange edge = state of underlined node must be at least 3; numbers denote the number of possible states for a node; dotted arrows are reactions involved in a transport process; red and thick edge = happens after 20 time steps (degradation). gray and dashed edge denotes a reaction that occurs by chance with a certain probability.
