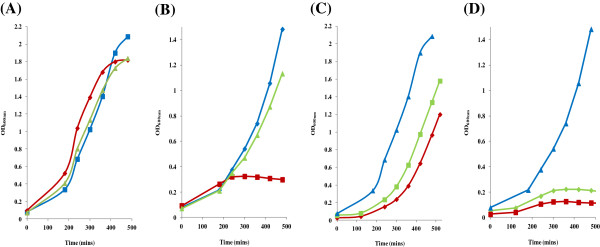
Figure 5.

Effect on growth rates of the pBAD33-orf43 SM12 and SM56 mutations in E. coli TOP10. (A) Un-induced growth rates for pBAD33 (blue curve), pBAD33-orf43 (red curve) and pBAD33-orf43 SM12 (green curve). (B) Induced growth rates for pBAD33 (blue curve), pBAD33-orf43 (red curve) and pBAD33-orf43[SM12] (green curve). (C) Un-induced growth rates for pBAD33 (blue curve), pBAD33-orf43 (red curve) and pBAD33-orf43 SM56 (green curve). (D) Induced growth rates for pBAD33 (blue curve), pBAD33-orf43 (red curve) and pBAD33-orf43[SM56] (green curve). Note that the SM12 mutation in pBAD33-orf43 caused a return to exponential growth behaviour expected with E. coli cells.
