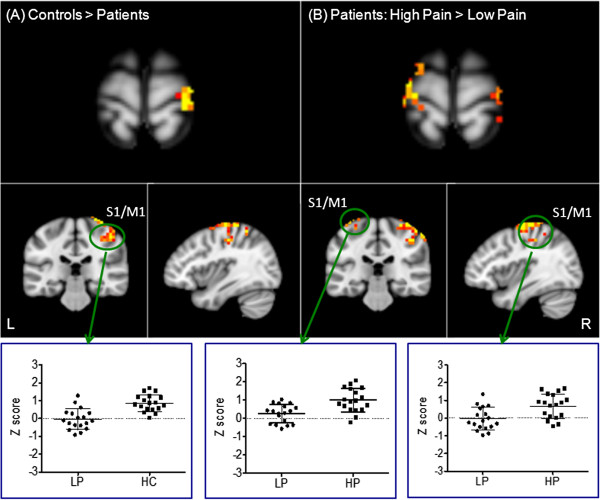
Figure 1.
Functional connectivity differences across different conditions. A: Functional connectivity differences between HCs and patients with low endogenous LBP; B: Functional connectivity differences between the high endogenous LBP condition and low endogenous LBP condition within patients. The bar indicates the scatter plot of the representative brain region showing significant changes. The y axis indicates the average functional connectivity z value of the cluster.

