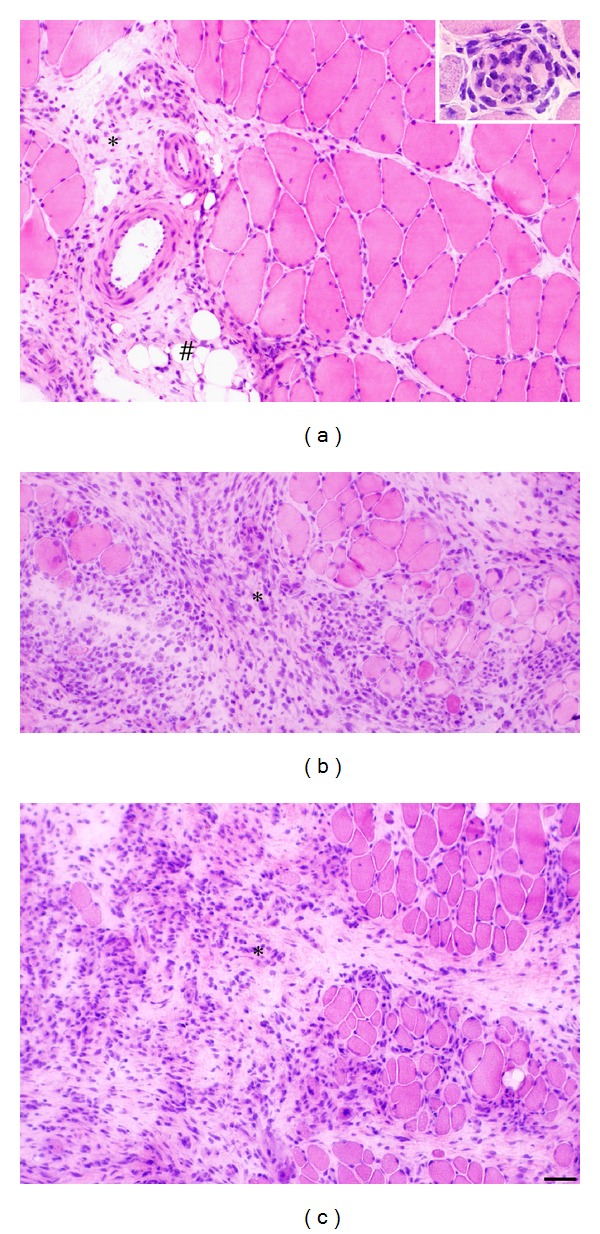
Figure 1.

Sections of the soleus muscle of the 6-week group, exercised side (a, b) and nonexercised side (c), stained with H&E. Morphological features are shown. There is an excess of connective tissue (asterisk) and presence of adipose tissue to the left in (a). There are pronounced inflammatory cell infiltrates in (b, c) (asterisks). There is an overall marked variability in muscle fiber sizes (b, c). In the inset in (a), a fiber that is invaded by numerous inflammatory cells is seen. The appearance to the right in (a) is to some extent resembling the situation for normal muscle. (#) indicates adipose tissue. Bar = 50 μm.
