
Figure 1.
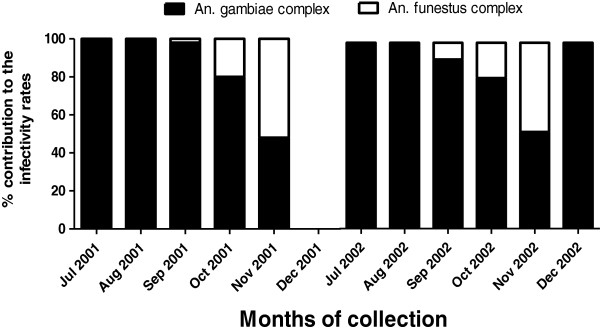
Species contribution to the overall monthly infectivity rates in 2001 and 2002. The black represents the contribution of Anopheles gambiae complex and the white the contribution of Anopheles funestus complex.
Official websites use .gov
A
.gov website belongs to an official
government organization in the United States.
Secure .gov websites use HTTPS
A lock (
) or https:// means you've safely
connected to the .gov website. Share sensitive
information only on official, secure websites.
Species contribution to the overall monthly infectivity rates in 2001 and 2002. The black represents the contribution of Anopheles gambiae complex and the white the contribution of Anopheles funestus complex.