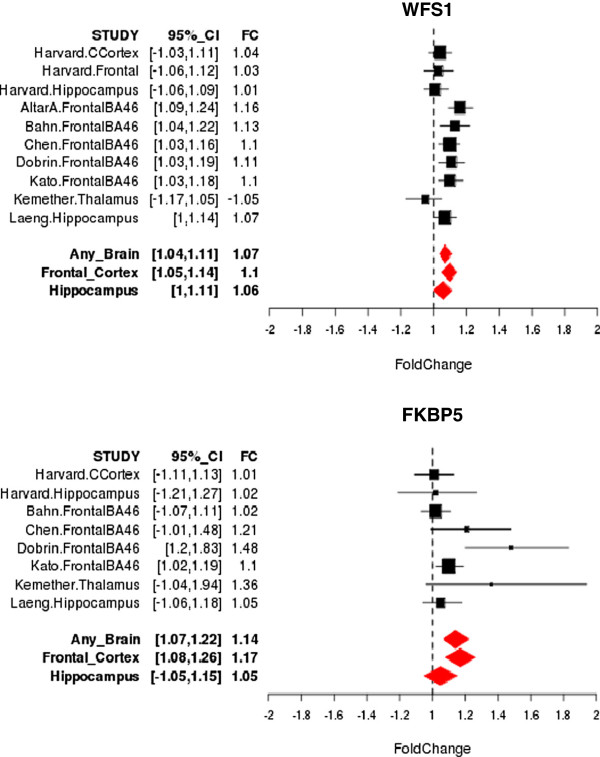
Figure 4.
Forest Plots of two genes of interest in mood disorders (q-value < 0.05) showing the estimated fold change (FC) of gene expression comparing BP cases and controls and 95% confidence interval for each study. Summary estimates are provided for any brain regions, prefrontal cortex and hippocampus.

