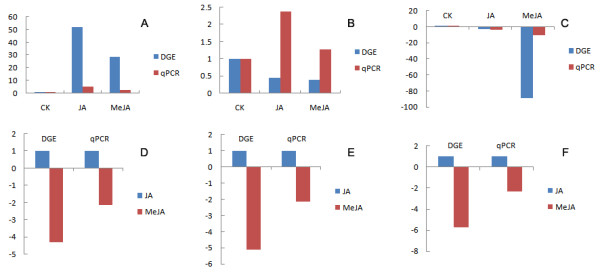
Figure 3.

qRT-PCR validation of DGE tag data. The x-axis indicates treatment method. The y-axis indicates relative expression level. The following selection of genes were tested with their description. (A) phenylalanine ammonialyase (Unigene 46956), (B) cinnamate 4-hydroxylase (Unigene 47342). (C) 4-coumarate-CoA ligase (Unigene 11155), (D) trans-cinnamate 4-monooxygenase (Unigene 20026), (E) caffeic acid 3-O-methyltransferase (Unigene 15709), (F) caffeoyl-CoA O-methyltransferase (Unigene 16480).
