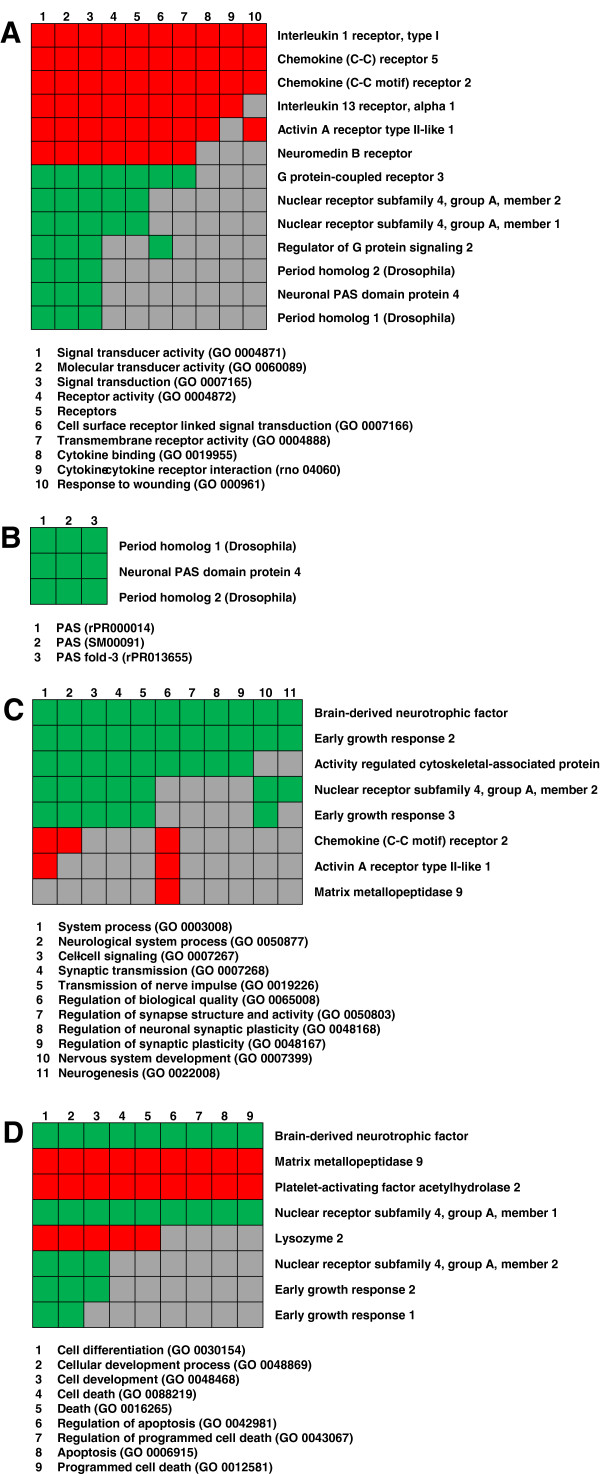
Figure 4.
Functional annotation cluster. The 120 significantly expressed genes were clustered into functionally related groups such as inflammatory response (A), circadian rhythm (B), neuronal signaling (C) and apoptosis / cell death (D) based on DAVID bioinformatics. The genes belonging to the individual clusters are listened on the right side. The suitable functions with the corresponding GO terms are mentioned below the clusters. Green marked squares state that the gene is up-regulated in that GO term, red marked squares stand for down-regulated genes, and grey filled squares mean that the gene is not involved in that process.

