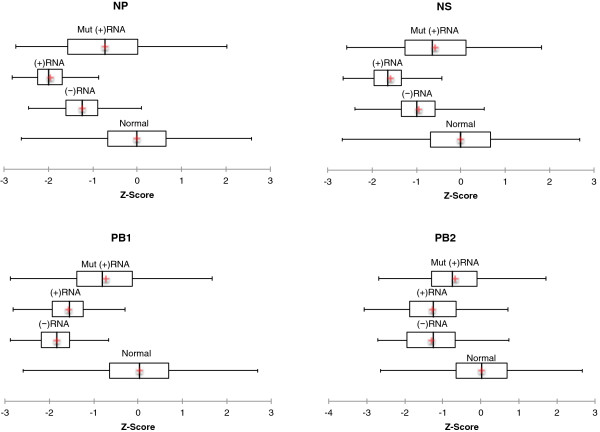
Figure 1.
Box plots of z-scores for influenza B wild-type coding regions with evidence of global ordered RNA structure and mutant sequences coding for the same protein: Boxes represent the interquartile region (IQR = Q3– Q1) for each distribution. The left edge of the box is the 25th percentile (Q1) and the right edge is the 75th percentile (Q3). The bar inside the box indicates the median and the red cross indicates the mean. Bars extending from the right and left of the box indicate the upper and lower bounds, respectively (See Materials and methods). GORS is considered present when the median for influenza sequences lies outside the IQR expected for an unstructured control population (i.e. a normal distribution centered at zero) shown at the bottom of each plot.

