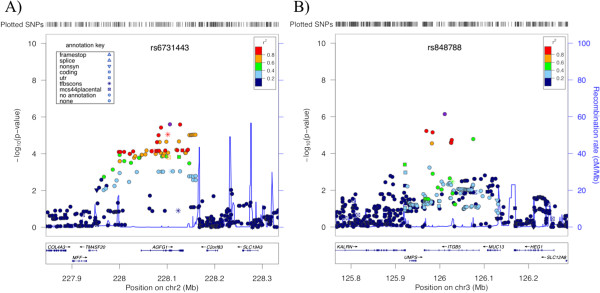
Figure 2.

Association regions of SNPs in/near (A) AGFG1 and (B) ITGB5. The x-axes denote position along corresponding chromosomes. The y-axes denote –Log10(P) corresponding to primary GWAS P-values of association with AHR. LD between the SNPs with the lowest P-values (rs6731443 and rs848788, in panels (A) and (B), respectively) to each SNP in the plots is denoted by colors and was computed according to hg18/HapMap Phase II CEU data. Plots were created using LocusZoom [21].
