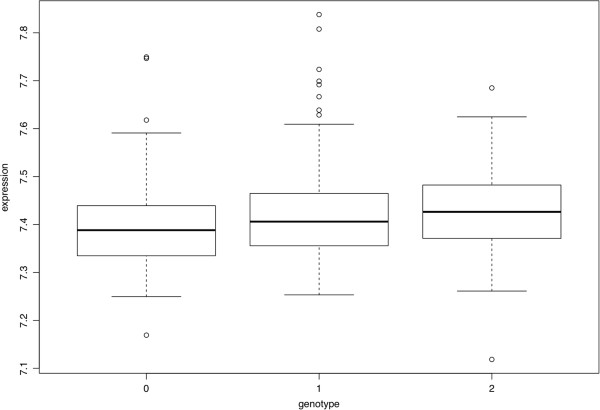
Figure 4.
Expression Quantitative Trait Loci (eQTL) results for AGFG1 expression levels by genotype of SNP rs6731443. The genotypes represented along the x-axis are GG (0), GT (1) and TT (2). The AGFG1 probe used to plot expression levels has Illumina Probe ID Hoirhennr8UexQTd6I. Plots of AGFG1 eQTLs for other top SNPs in Table 2 are similar to those in this Figure.

