
Figure 2.
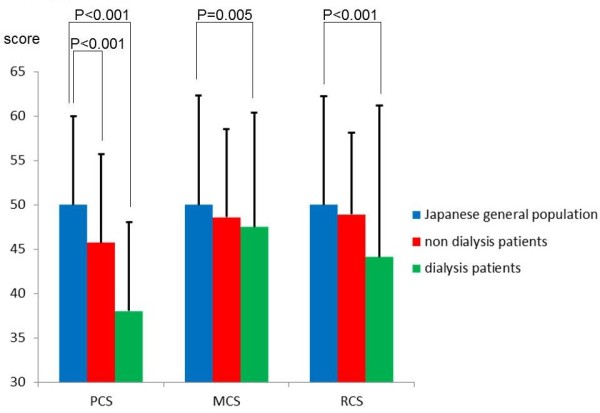
Comparison of the SF-36 scores (PCS, MCS, and RCS) for all enrolled patients, non-dialysis patients, dialysis patients, and the general Japanese population.
Official websites use .gov
A
.gov website belongs to an official
government organization in the United States.
Secure .gov websites use HTTPS
A lock (
) or https:// means you've safely
connected to the .gov website. Share sensitive
information only on official, secure websites.
Comparison of the SF-36 scores (PCS, MCS, and RCS) for all enrolled patients, non-dialysis patients, dialysis patients, and the general Japanese population.