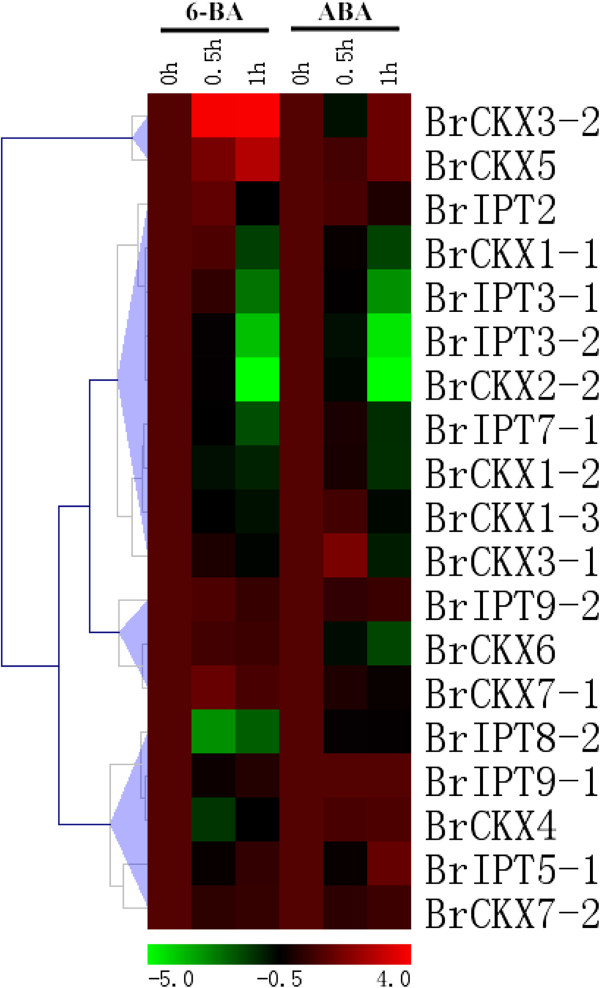
Figure 10.
The heat map shows the real-time quantitative RT-PCR (qRT-PCR) analysis results of BrIPT and BrCKX genes with exogenous 6-BA and ABA treatments with two biological and three technical replicates. The expression levels of genes are presented using fold-change values transformed to Log2 format compared to control. The Log2 (fold-change values) and the color scale are shown at the bottom of heat map.

