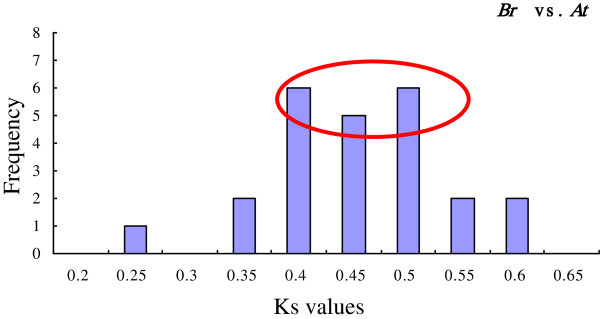
Figure 7.

The Ks values distribution of IPT and CKX genes in the genomes of B. rapa and A. thaliana. The vertical axis indicates the frequency of paired sequences, whereas the horizontal axis denotes the Ks values with an interval of 0.05. The bars depict the positions of the modes of Ks distributions obtained from orthologous gene pairs. The peaks of the bars are marked with a red circle which represents the principal distribution extent of the Ks values.
