Figure 2.

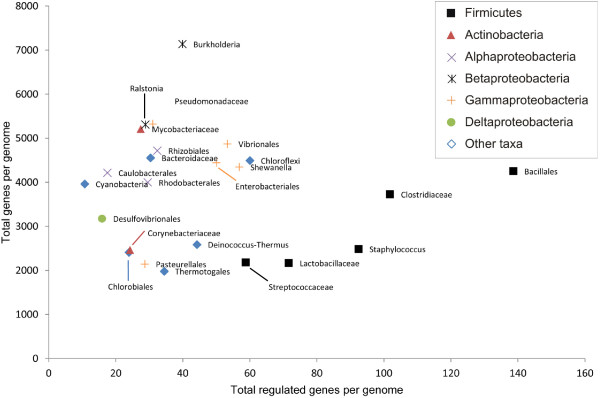
Scatter plot of all identified RNA motif-regulated genes versus total number of genes in an individual taxon. Each dot in the figure represents the average value of all the genomes in that taxon.

Scatter plot of all identified RNA motif-regulated genes versus total number of genes in an individual taxon. Each dot in the figure represents the average value of all the genomes in that taxon.