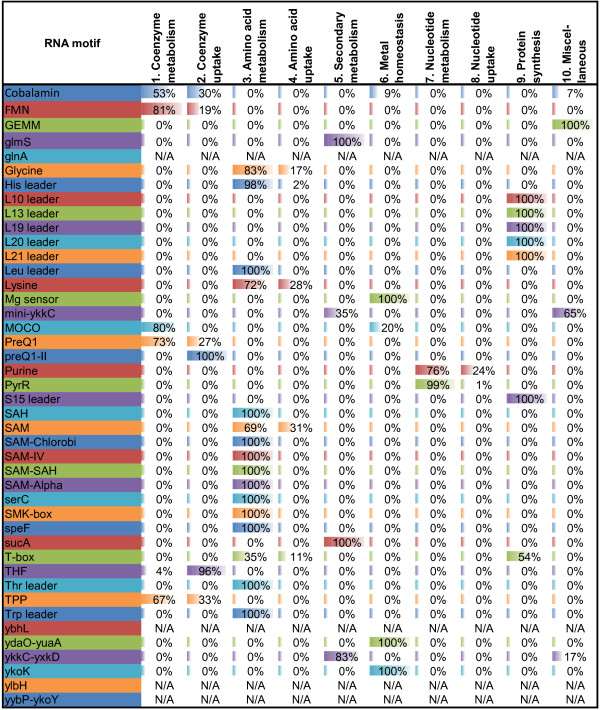
Figure 8.
Proportion of overall functional categories for individual RNA motifs. For each RNA motif, the relative contribution of ten overall functional categories (OFCs) to the riboswitch-regulated genes with assigned functions is shown. The proportions are calculated based on cumulative OFC statistics for all studied taxonomic groups provided in Additional file 6 and exclude functionally unknown genes. The colored bar in each cell is proportional to the total number of OFC for each RNA motif family with different colors used for each row. RNA motifs controlling genes without assigned OFCs have their rows labeled as ‘N/A’.

