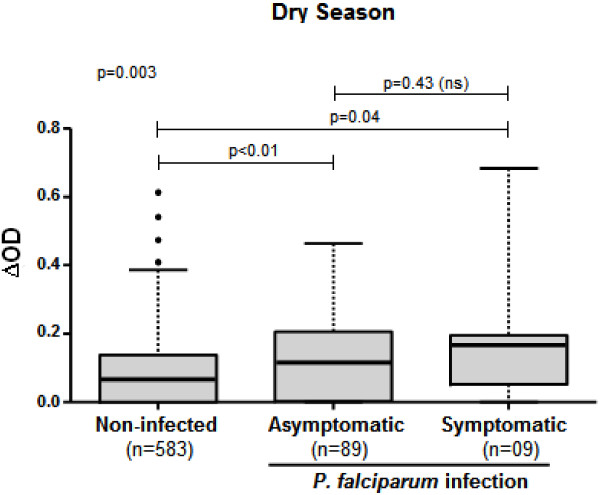
Figure 2.
IgG response levels to gSG6-P1 peptide according to malaria status. Box plots show anti-gSG6-P1 IgG level (∆OD) between uninfected, infected-asymptomatic and infected-symptomatic individuals (cumulative data from January and June 2009). Boxes display the median ∆OD value, 25th and 75th percentiles. The whiskers show the 5th/95th percentiles and the dots indicate the outliers. Differences between two or three groups were tested using Mann Whitney test and Kruskal Wallis test, respectively.

