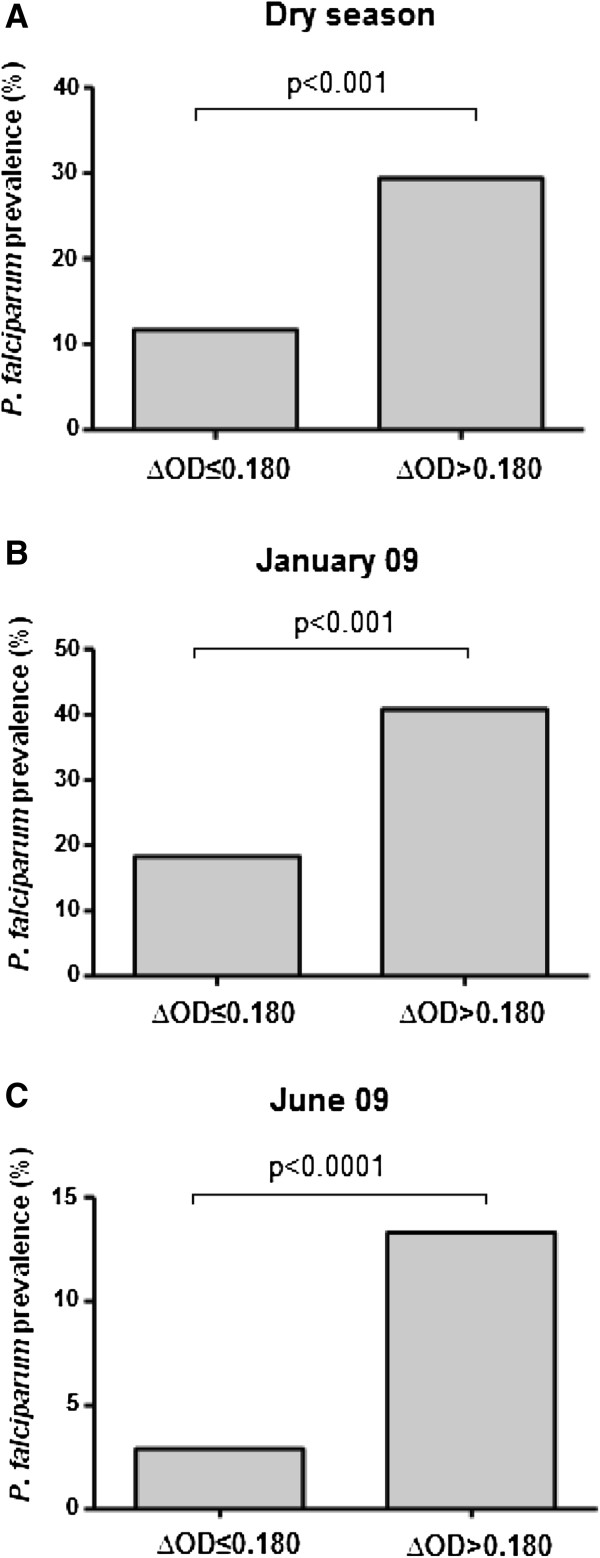
Figure 3.
Plasmodium falciparumprevalence between IgG responders and non-responders to gSG6-P1 peptide. Data present the rate of P. falciparum infection according to the two defined immune responder groups: non-responders to gSG6-P1 (∆OD ≤ 0.180) and responders to gSG6-P1 (∆OD > 0.180) during the whole dry season (cumulative data) (A), in January 09 (B) and in June 09 (C). Statistical significant difference between these two groups is indicated using a Chi2 test.

