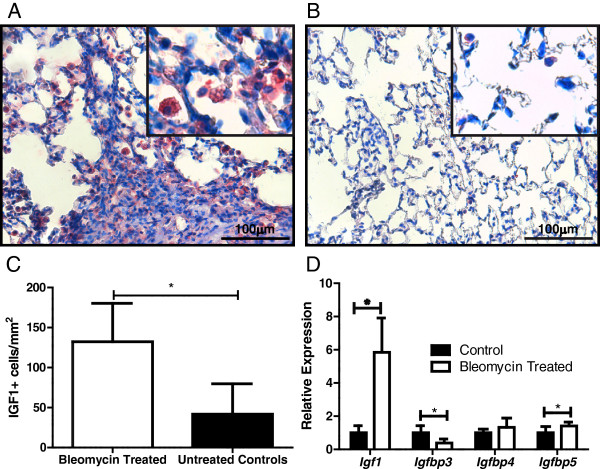
Figure 4.
Pulmonary expression of IGF-1 pathway genes in bleomycin treated and control C57BL/6J mice. Immunohistochemistry of Igf1 in (A) bleomycin treated lungs and (B) control lungs. Magnification 400×, insert magnification 1000×. (C) Quantification of Igf-1 positive cells per mm2 lung tissue ± standard deviation of n = 4 mice per group. (D) qRT-PCR of lung tissue from bleomycin treated and control mice for genes of the IGF-1 pathway. Expression is relative to reference gene Ataxin 10. Average ± standard deviation of n = 6 to 8 mice per group. * indicates a significant difference between groups, P < 0.05.

