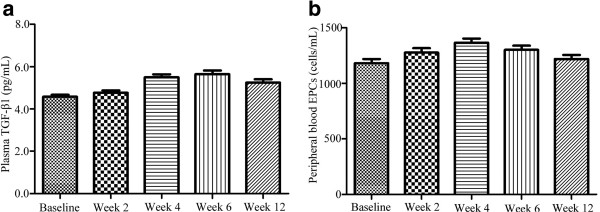
Figure 1.
Changes of TGF-β1 and EPCs during and after the treatment. a. Change of TGF-β1 during and after the treatment. Variations of transforming growth factor-beta-1 (TGF-β1) at baseline, during, and after treatment in the whole group. Values are presented as mean ± S.E. b. Change of EPCs during and after the treatment. Variations of circulating endothelial progenitor cells (EPCs) at baseline, during, and after treatment in the whole group. Values are presented as mean ± S.E.

